Posts

Showing posts from February, 2017

A mail from a share holder to the management of INFOSYS

 Name : XXXXXXXXXXX  [Pan: xxxxxxxxxx] CDSL ClientID: xxxxxxxxxxxxxxxx  xxxxxx To, Ranganath D. Mavinakere Chief Financial Officer INFOSYS. Sandeep Mahindroo Financial Controller and Head – Investor Relations INFOSYS. AGS Manikantha Company Secretary INFOSYS. Dear Sir,  I am holding 100 shares of INFOSYS in the above demat account; so I am a shareholder of INFOSYS. There are so many talks in the media, after the Rs.16000 Cr buyback announcement from TCS and there are so many circulating stories or reports of uncertain or doubtful truths, and speculations in the media that our company (INFOSYS LTD) is also going to announce a simil...

Warren-mania

Image

BANK NIFTY - macro view

Image
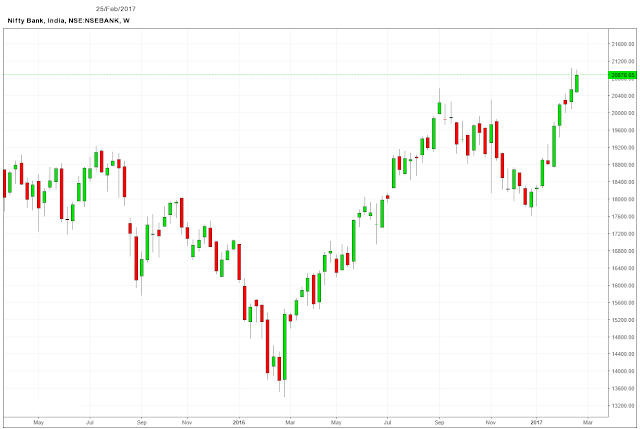
BANKNIFTY (20877) - 21000 will become crucial for the macro point of view. if new uptrend emerges, then 23500 & ultimate 28400, but if it failed, then 17600 & ultimate 14600 In between the macro , so many micros will be part and parcel.

NIFTY vs NDTV

Image
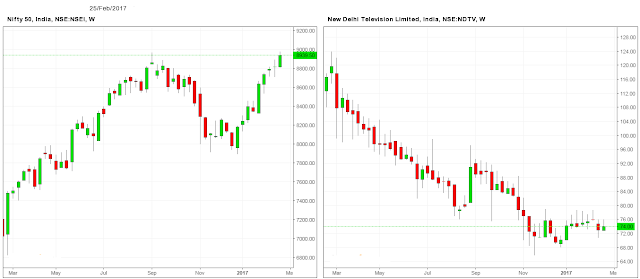
NDTV  moving quite opposite of the market trend  (In the crowd, understand the underlying is important)

RELIANCE - after 7

Image
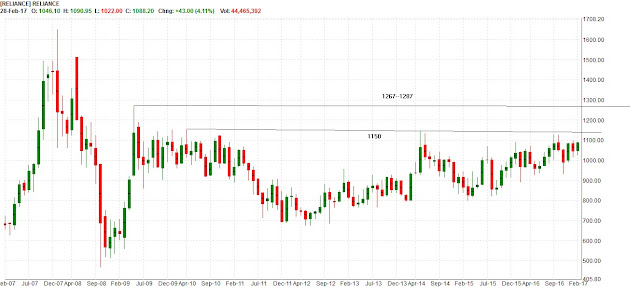
 It is moving up after 7 years... 

JINDALSTEL

Image
JINDALSTEL owners fund 18K Cr. vs 7K Cr. Market Cap || last 8 consecutive Qtrs cumulative loss 6.3K Cr. || still they have 11K Cr. to match — Murugavel (@murugavell) January 11, 2017  Market cap as of now at 9.8 K Cr.  ------------------------------------------- JINDALSTEL - 2 YEARS - MONTHLY 

Indian Mutual Fund industry’s Avg. Assets Under Management (AAUM) are at all time high ! - ₹ 17.83 Lakh Crore

Image
Average  Assets Under Management (AAUM) of Indian Mutual Fund Industry  for the month of January 2017 has crossed  ₹ 17.83 lakh crore, while the Assets Under Management (AUM)  as on January 31, 2017 stood at  ₹17.37 lakh crore The AUM of the Indian MF Industry has grown from ₹ 3.26 trillion as on 31st March 2007 to ₹ 17.83 trillion as on 31st January, 2017, a five-fold increase in a span of less than 10 years !! The MF Industry’s AUM has more doubled in the last 4 years from ₹ 5.87 trillion as on 31st March, 2012 to ₹ 12.33 trillion as on 31st March, 2016 The Industry’s AUM had crossed the milestone of  ₹10 Trillion  (₹10 Lakh Crore) for the first time in May 2014 and in a short span of two years and eight months, the AUM size has crossed ₹17.37 lakh crore last month. The total number of accounts (or folios as per mutual fund parlance) as on January 31, 2017 stood at 5.38 crore (53.8 million), while the number of folios under Equity, ...

LIVERMORE ERA & GRAHAM ERA

Image
Most of times, Stock Market has only two era based on the two legends' Psychology/Temperament /Attitude of  LIVERMORE & GRAHAM        In the last dozen years in Indian Stock Market, GRAHAM era worked out only in two periods ,  that was between the last quarter of 2008 to first quarter of 2009  (Oct. 2008 to March 2009)  and third quarter of 2011 to first quarter of 2014  (July 2011 to March 2014) and almost all other periods were/are belongs to LIVERMORE era  GRAHAM period era belongs to real investors LIVERMORE period era belongs to traders/positional traders.  When will be the next GRAHAM era going to starts ?  WAIT, patiently wait,  at present, that is the only answer.   below NIFTY monthly chart explains, how the the two legends era working out...
Image

Avenue Supermarts Ltd

Image
Avenue Supermarts Ltd. is all set to become the second initial public offering (IPO) to hit the primary markets in 2017. It is also being touted as the biggest IPO from the retail sector since 2007. The supermarket chain, founded and promoted by well-known investor Radhakishan Damani, plans to raise as much as Rs 1,870 crore from the primary market, by diluting 10 percent of its post-issue equity share capital, pegging its total market capitalisation at Rs 18,700 crore. . Detailed in BQ.  How D-Mart Stacks Up Against Peers

MSCI ACWI - now at "Make or Break" level

Image
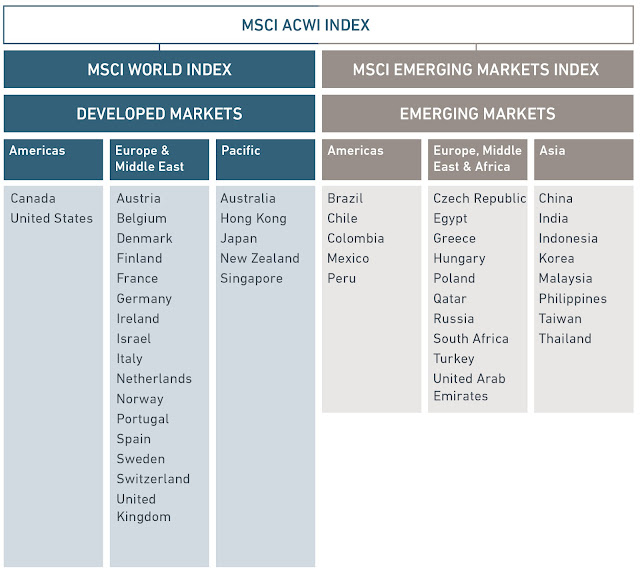
MSCI ACWI  captures large and mid cap representation across 23 Developed Markets (DM) and 23 Emerging Markets (EM)  and has over $2.5 trillion in assets bench-marked to the MSCI World index family.          MSCI ACWI -  now re-test the previous high and at over bought zone. 

Today - India's Space Agency will attempt to send 104 Satellites into Orbit.

Image

APPLE

Image
APPLE ($133.29) -  Now target and resistance 139--147 but above that  ULTIMATE  UPSIDE TARGET 179-182. -------------------------- ​ Whenever APPLE reach $ 182 ​with the existing equity capital, that will be the memorable and historic day for the  stock market in the world,  because,  at that price, it will become a first One Trillion Dollar  market cap. company in the world.  ------------------------------------- --------------------------------------- About the Trillion Dollar :  Hoped in 21st Aug. 2012 post itself and the hope still continue...

Fuel consumption fell 4.5 % in January

Image

COPPER (cfd) - 10 Years - Monthly

Image

INDIA vs Rest of Asia

Image

CHRONICLE

Image
Hindustan Motors Ltd., India’s oldest carmaker, has sold the Ambassador brand - BQ

SUGAR STOCKS - 17 MONTHS SWEET SPOT

Image
On 23rd March 2016, Posted here regarding sugar sector and some sugar stocks, click here to see that post.   Now sugar sector uptrend phase 17 months old. How long it can sustain ?  Can history give some clue ?  May be.  Last Sugar Sector uptrend phase life was 3 years ( May 2003 to April 2006) after that 9 years downtrend & consolidation phase(2006-2015)-1/2 — Murugavel (@murugavell) February 10, 2017 -2/2, Present uptrend phase in Sugar Sector started in Oct 2015, price-wise already several X rewarded  &  now we are in  17th month — Murugavel (@murugavell) February 10, 2017 If history repeats, time-wise, we are in half way mark so  can expect sugar sector top out / peak out  somewhere 3rd Quarter of 2018 — Murugavel (@murugavell) February 10, 2017 *** Points to be remember :  Time-wise ,already, it crossed half way mark and  Price...

INDIA become No.2 in the World in 2050

Image
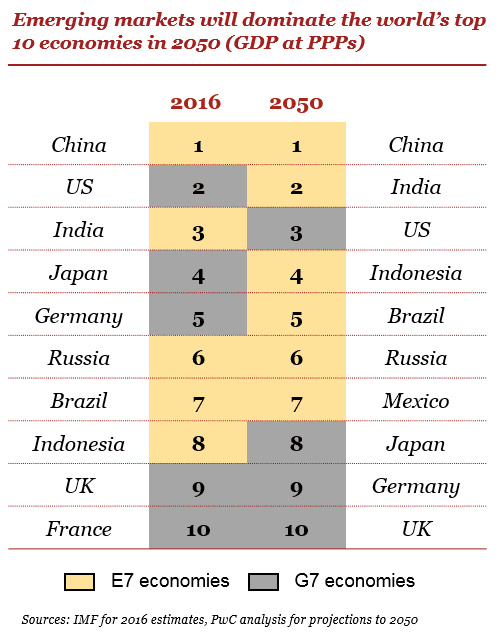
THE WORLD in  2050 The long view: how will the global economic order change by 2050? 2nd India’s global GDP ranking at PPPs by 2050 (behind China but ahead of the US) 20% China’s projected share of world GDP at PPPs by 2050 130% Cumulative global GDP growth between 2016 and 2050 9% EU27’s share of global GDP at PPPs by 2050 (excluding UK) Download the full report  "WORLD IN 2050" 

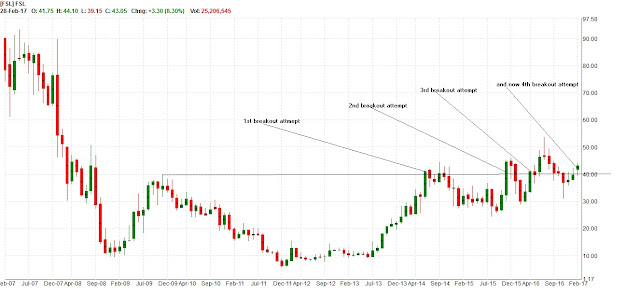
How many attempts require to take it to the next level ?

Image
FSL - 10 YEARS MONTHLY

WISDOM PYRAMID

Image